Background
The United States has a long history of systemic racism that continues to permeate society in both obvious and hidden ways. One of the many consequences of this is the fact that poor or marginalized communities are exposed to and harmed by air pollution, hazardous waste, resource extraction, and more at a disproportionate amount. The environmental justice movement was born from this and has been fighting for community protection, enforcement of environmental regulations and policies, and exposing this reality.
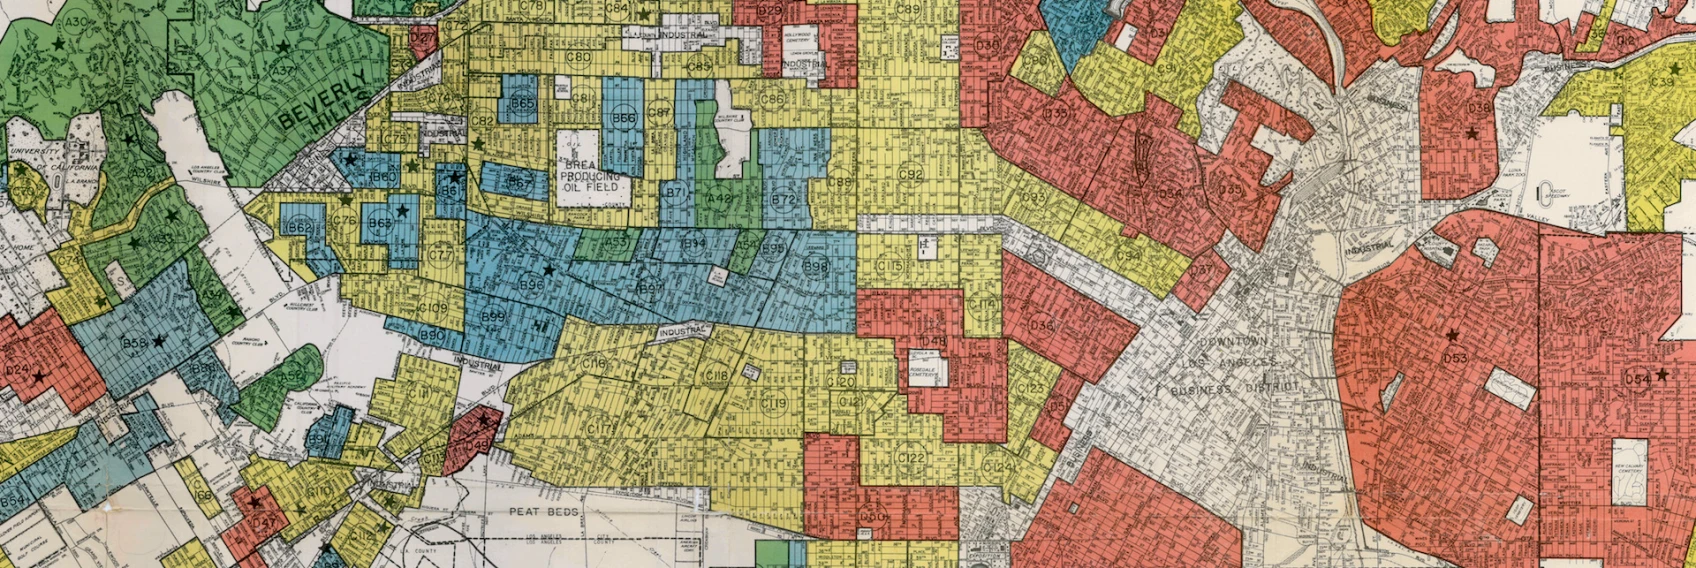
One historical reason for the present day conditions can be traced back to the 1930s. As part of the New Deal, the Home Owner’s Loan Corporation (HOLC) rated neighborhoods based on their perceived safety for real estate investment. Their ranking system, (A (green), B (blue), C (yellow), D (red)) was then used to block access to loans for home ownership. As you might guess, racism played a leading role in the designation of grades and led to the phenomenon colloquially known as “redlining.” This practice has had widely-documented consequences on community wealth, environment, and health. Redlined neighborhoods have less greenery and are hotter than other neighborhoods. Lee and co-authors, in a meta-analysis, found that “gunshot-related injuries, asthma, heat-related outcomes, and multiple chronic conditions were worse in redlined areas.”
Check out coverage by the New York Times.
A recent study found that redlining has not only affected the environments and health hazards communities are exposed to, it has also shaped our observations of biodiversity. Community or citizen science, whereby individuals share observations of species on their own time, is generating an enormous volume of data. In recent years, apps such as iNaturalist have enabled more people to identify and report various species of plants and animals. This increase, however, has also highlighted areas of missingness–where individuals do not, or cannot, participate in citizen science for various reasons. Ellis-Soto and co-authors found that redlined neighborhoods remain the most undersampled areas across 195 US cities. This gap is highly concerning, because conservation decisions and policies are made based on these data. If impactful decisions are being made on inaccurate data, this could lead to actions that continue to harm poor and marginalized communities.
Check out coverage by EOS.
Data Descriptions
Three datasets will be used to answer our questions: US EPA EJScreen data, digitized HOLC maps, and bird biodiveristy observations in LA.
EJScreen
The United States Environmental Protection Agency’s Environmental Justice Screening and Mapping Tool is an effort to provide national data for advancing their goals and supporting others interested in environmental justice.
According to the US EPA website:
This screening tool and data may be of interest to community residents or other stakeholders as they search for environmental or demographic information. It can also support a wide range of research and policy goals. The public has used EJScreen in many different locations and in many different ways.
EPA is sharing EJScreen with the public:
- to be more transparent about how we consider environmental justice in our work,
- to assist our stakeholders in making informed decisions about pursuing environmental justice and,
- to create a common starting point between the agency and the public when looking at issues related to environmental justice.
EJScreen provides environmental and demographic information for the US at the Census tract and block group levels. Block group data has been downloaded, and stored locally, from the EPA site.
Mapping Inequality
A team of researchers, led by the Digital Scholarship Lab at the University of Richmond have digitized maps and information from the HOLC as part of the Mapping Inequality project.
This analysis uses maps of HOLC grade designations for Los Angeles via URL. Information on the data can be found here.
Biodiversity observations
The Global Biodiversity Information Facility is the largest aggregator of biodiversity observations in the world. Observations typically include a location and date that a species was observed. This analysis will use bird observations in 2022.
